Graph - Bar section
A bar graph section displays aggregated data as vertical or horizontal bars, making it ideal for comparing values across discrete time periods or categories. Unlike line graphs that show continuous trends, bar graphs emphasize individual data points and make it easier to compare specific values.
Bar graphs excel at showing:
- Aggregated values over time periods (hourly totals, daily averages, etc.)
- Comparisons between multiple fields displayed side-by-side
- Discrete time buckets rather than continuous trends
For bar graphs, you need a query that returns:
- Time values or categories for the X-axis (usually aggregated into buckets)
- One or more aggregated numeric fields for the Y-axis (bar heights)
- Aggregation functions (AVG, SUM, MAX, MIN, COUNT) to summarize data within each bucket
For more info on how to write queries, check the query differences for database and query examples
Basic example - Hourly averages
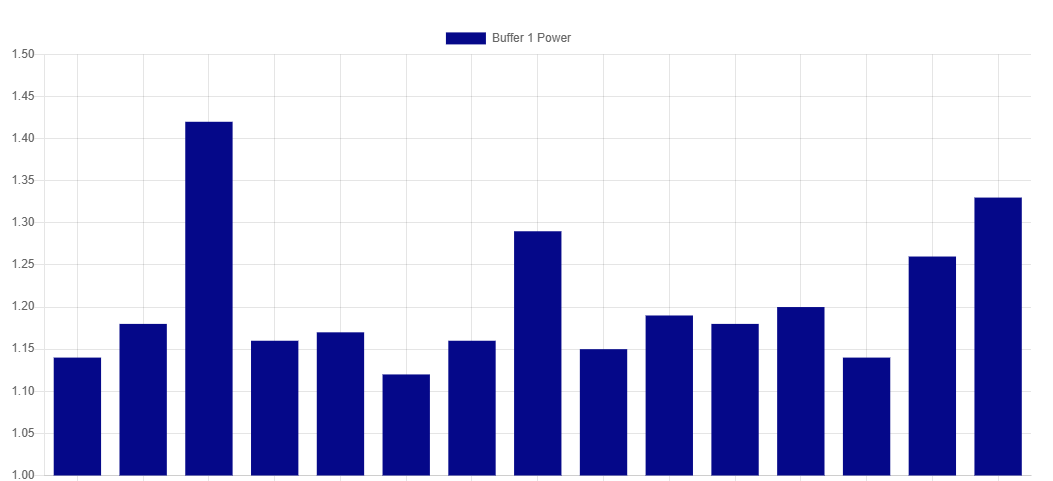 This example shows average power consumption per hour, with each hour displayed as a separate bar. This makes it easy to identify peak usage hours.
SELECT
  time AS "time",
  MEAN("InputBuffer1_PowerKw") AS "Buffer 1 Power"
FROM "oneWeek"."Line1"
WHERE time >= '2026-05-03T00:00:00+02:00'
  AND time < '2026-05-03T12:00:00+02:00'
GROUP BY TIME(1h)
ORDER BY time DESC
SELECT
  time_bucket('1 hour', time) AS "time",
  AVG("inputbuffer1_powerkw") AS "Buffer 1 Power"
FROM "docsdemo_timescale_wide"."line1"
WHERE time >= '2026-05-03 00:00:00+02'
  AND time < '2026-05-03 12:00:00+02'
GROUP BY time_bucket('1 hour', time)
ORDER BY time_bucket('1 hour', time) DESC
SELECT
  time_bucket('1 hour', time) AS "time",
  AVG(value) AS "Buffer 1 Power"
FROM "line1"
WHERE name = 'InputBuffer1_PowerKw'
  AND time >= '2026-05-03 00:00:00+02'
  AND time < '2026-05-03 12:00:00+02'
GROUP BY time_bucket('1 hour', time)
ORDER BY time_bucket('1 hour', time) DESC
WITH wide_data AS (
  SELECT
    time_bucket('1 hour', time) AS bucket_time,
    AVG(CASE WHEN name = 'InputBuffer1_PowerKw' THEN value::numeric END) AS buffer1
  FROM "line1"
  WHERE time >= '2026-05-03 00:00:00+02'
    AND time < '2026-05-03 12:00:00+02'
    AND name = 'InputBuffer1_PowerKw'
  GROUP BY bucket_time
)
SELECT
  bucket_time AS "time",
  buffer1 AS "Buffer 1 Power"
FROM wide_data
ORDER BY bucket_time DESC
Multiple bars - Side-by-side comparison

This example displays two fields as side-by-side bars for each time period. Unlike other visualization types, bar charts require separate queries for each field you want to display. Each query returns data for one bar series.
Buffer 1 Power:
SELECT
  time AS "time",
  MEAN("InputBuffer1_PowerKw") AS "Buffer 1 Power"
FROM "oneWeek"."Line1"
WHERE time >= '2026-05-03T00:00:00+02:00'
  AND time < '2026-05-03T12:00:00+02:00'
GROUP BY TIME(1h)
ORDER BY time DESC
Buffer 2 Power:
SELECT
  time AS "time",
  MEAN("InputBuffer2_PowerKw") AS "Buffer 2 Power"
FROM "oneWeek"."Line1"
WHERE time >= '2026-05-03T00:00:00+02:00'
  AND time < '2026-05-03T12:00:00+02:00'
GROUP BY TIME(1h)
ORDER BY time DESC
Buffer 1 Power:
SELECT
  time_bucket('1 hour', time) AS "time",
  AVG("inputbuffer1_powerkw") AS "Buffer 1 Power"
FROM "docsdemo_timescale_wide"."line1"
WHERE time >= '2026-05-03 00:00:00+02'
  AND time < '2026-05-03 12:00:00+02'
GROUP BY time_bucket('1 hour', time)
ORDER BY time_bucket('1 hour', time) DESC
Buffer 2 Power:
SELECT
  time_bucket('1 hour', time) AS "time",
  AVG("inputbuffer2_powerkw") AS "Buffer 2 Power"
FROM "docsdemo_timescale_wide"."line1"
WHERE time >= '2026-05-03 00:00:00+02'
  AND time < '2026-05-03 12:00:00+02'
GROUP BY time_bucket('1 hour', time)
ORDER BY time_bucket('1 hour', time) DESC
Buffer 1 Power:
SELECT
  time_bucket('1 hour', time) AS "time",
  AVG(value) AS "Buffer 1 Power"
FROM "line1"
WHERE name = 'InputBuffer1_PowerKw'
  AND time >= '2026-05-03 00:00:00+02'
  AND time < '2026-05-03 12:00:00+02'
GROUP BY time_bucket('1 hour', time)
ORDER BY time_bucket('1 hour', time) DESC
Buffer 2 Power:
SELECT
  time_bucket('1 hour', time) AS "time",
  AVG(value) AS "Buffer 2 Power"
FROM "line1"
WHERE name = 'InputBuffer2_PowerKw'
  AND time >= '2026-05-03 00:00:00+02'
  AND time < '2026-05-03 12:00:00+02'
GROUP BY time_bucket('1 hour', time)
ORDER BY time_bucket('1 hour', time) DESC
Buffer 1 Power:
WITH wide_data AS (
  SELECT
    time_bucket('1 hour', time) AS bucket_time,
    AVG(CASE WHEN name = 'InputBuffer1_PowerKw' THEN value::numeric END) AS buffer1
  FROM "line1"
  WHERE time >= '2026-05-03 00:00:00+02'
    AND time < '2026-05-03 12:00:00+02'
    AND name = 'InputBuffer1_PowerKw'
  GROUP BY bucket_time
)
SELECT
  bucket_time AS "time",
  buffer1 AS "Buffer 1 Power"
FROM wide_data
ORDER BY bucket_time DESC
Buffer 2 Power:
WITH wide_data AS (
  SELECT
    time_bucket('1 hour', time) AS bucket_time,
    AVG(CASE WHEN name = 'InputBuffer2_PowerKw' THEN value::numeric END) AS buffer2
  FROM "line1"
  WHERE time >= '2026-05-03 00:00:00+02'
    AND time < '2026-05-03 12:00:00+02'
    AND name = 'InputBuffer2_PowerKw'
  GROUP BY bucket_time
)
SELECT
  bucket_time AS "time",
  buffer2 AS "Buffer 2 Power"
FROM wide_data
ORDER BY bucket_time DESC
Total consumption per period
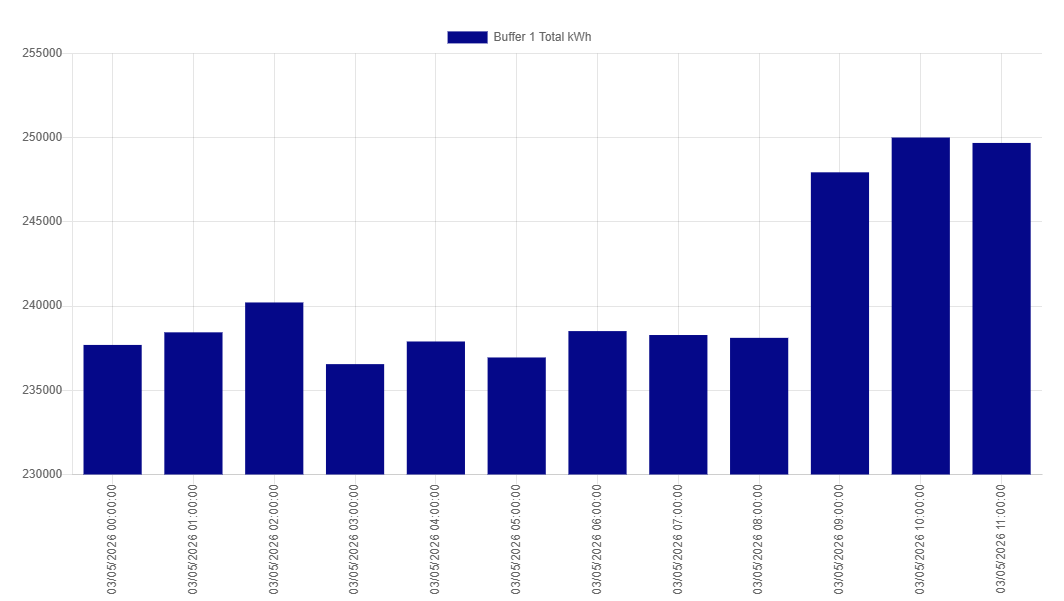
This example uses SUM aggregation to show total energy consumption per hour, useful for understanding cumulative usage within each time period.
SELECT
  time AS "time",
  SUM("InputBuffer1_PowerKw") AS "Buffer 1 Total kWh"
FROM "oneWeek"."Line1"
WHERE time >= '2026-05-03T00:00:00+02:00'
  AND time < '2026-05-03T12:00:00+02:00'
GROUP BY TIME(1h)
ORDER BY time DESC
SELECT
  time_bucket('1 hour', time) AS "time",
  SUM("inputbuffer1_powerkw") AS "Buffer 1 Total kWh"
FROM "docsdemo_timescale_wide"."line1"
WHERE time >= '2026-05-03 00:00:00+02'
  AND time < '2026-05-03 12:00:00+02'
GROUP BY time_bucket('1 hour', time)
ORDER BY time_bucket('1 hour', time) DESC
SELECT
  time_bucket('1 hour', time) AS "time",
  SUM(value) AS "Buffer 1 Total kWh"
FROM "line1"
WHERE name = 'InputBuffer1_PowerKw'
  AND time >= '2026-05-03 00:00:00+02'
  AND time < '2026-05-03 12:00:00+02'
GROUP BY time_bucket('1 hour', time)
ORDER BY time_bucket('1 hour', time) DESC
WITH wide_data AS (
  SELECT
    time_bucket('1 hour', time) AS bucket_time,
    SUM(CASE WHEN name = 'InputBuffer1_PowerKw' THEN value::numeric END) AS buffer1
  FROM "line1"
  WHERE time >= '2026-05-03 00:00:00+02'
    AND time < '2026-05-03 12:00:00+02'
    AND name = 'InputBuffer1_PowerKw'
  GROUP BY bucket_time
)
SELECT
  bucket_time AS "time",
  buffer1 AS "Buffer 1 Total kWh"
FROM wide_data
ORDER BY bucket_time DESC